
2016 City Council Districts Map
October 12, 2012This week, the City of Philadelphia Office of Innovation and Technology released the new City Council districts boundaries shapefile. The city charter mandates that within six months of new census data being released, City Council has to redraw the district boundaries to account for shifts in population (each district should contain roughly the same number of people). You might remember that Council nearly missed their deadline. In the end, they were able to come up with new boundaries based off 2010 census data, but kept the existing boundaries active until 2016.
I made a quick interactive map to show how these new boundaries compare to the current boundaries. The goal of the map is to allow users, with a simple click or hover, to find out which current and future district a certain area falls within.
The tricky part was figuring out a way to get the district information from both the 2000 and 2016 layers no matter which districts layers were turned on or which layer was on top of the other. I used Leaflet, which doesn’t propagate events through each active layer, nor does it have a point in polygon function (point in bounding box doesn’t quite work with irregular shapes). I also wanted to give the user district information even when both the 2000 and 2016 layers were turned off.
The solution was to create a transparent layer that contained information for both district layers. The first step in creating this layer is to intersect the 2000 and 2016 layers. I used QGIS’s vector intersect function to do this. Here is the output:
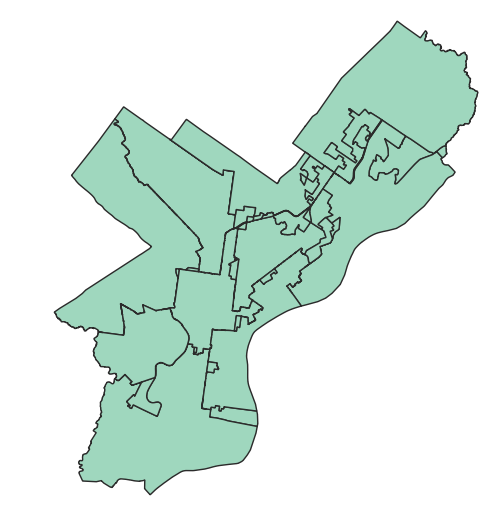
Basically, for each area where polygons from both layers overlap, a new polygon is created which contains the attributes from both layers. The ArcMap documentation has a simple graphic showing how this function works.
Once I had the resulting shapefile, I needed to convert it to GeoJSON format–which are quite easy to add to a Leaflet map. A quick and painless way to do this is with the ogr2ogr command line tool that is part of ever-helpful Geospatial Data Abstraction Library. Here we convert the shapefile to the WGS 84 map projection from state plane, and only include the fields we need for the map:
$ ogr2ogr -f GeoJSON -t_srs EPSG:4326 -select dist_2000, dist_2016 intersect.json intersect.shp
This layer is then added on top of the other layers, but all the color attributes are set to transparent. When a user clicks or hovers over the map, they are actually hovering over the intersect layer. In leaflet (and in SVG graphics in general), elements that are drawn last are put on top of existing elements. To make sure the transparent layer is always on top of the other layers, we push it to the front if a user clicks or hovers over one of the other visible layers. The transparent layer is added to a FeatureGroup, which has a handy bringToFront() method. Here is a simplified version of the code:
    2000_districts = new L.geoJson(2000_districts_geojson, {
      onEachFeature: function (feature, layer) {
        layer.on({
          mouseover: function(){
            transparent_layer.bringToFront();
          },
          click: function() {
            transparent_layer.bringToFront();
          }
        })
      }
    });
The same code is applied to the 2016 layer. Now if either of the visible layers are turned off and on (which puts it on top of all the other layers), when the user clicks or hovers over the map, the transparent layer is pushed to the front, and the district information is updated on the page. Both visible layers can also be turned off, and the user will still get district information for the area of the city they click on.
The downside to this method is that there an additional, more complex layer on the map. Even though you can’t see the transparent layer, it still takes resources to load and draw. A faster solution would be to render map tiles using TileMill using the same transparent, intersect layer technique. However, once I exported the transparent tiles, the interaction I set up was lost. Given this, I think the transparent vector layer approach is a good way to solve overlapping layer interactivity.